-
Welcome to Tacoma World!
You are currently viewing as a guest! To get full-access, you need to register for a FREE account.
As a registered member, you’ll be able to:- Participate in all Tacoma discussion topics
- Communicate privately with other Tacoma owners from around the world
- Post your own photos in our Members Gallery
- Access all special features of the site
 I need Job Security... hahaha
 Dog nail clipper recommendations
 Go the F**k to Sleep, read by Samuel L Jackson
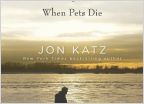 The Perfect Day
 TacomaWorld Secret Santa 2018 Wish List
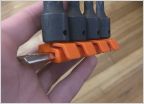 Mystery Socket Rail Brand
statistics help anybody
Discussion in 'Off-Topic Discussion' started by jdhaas3, Dec 10, 2011.