

-
Welcome to Tacoma World!
You are currently viewing as a guest! To get full-access, you need to register for a FREE account.
As a registered member, you’ll be able to:- Participate in all Tacoma discussion topics
- Communicate privately with other Tacoma owners from around the world
- Post your own photos in our Members Gallery
- Access all special features of the site
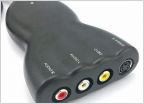 External HD - MacBook Pro - PS3 - TV? Help!!!!
 C++ Help
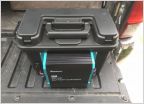 Make your own 400Wh portable power battery for less than $100
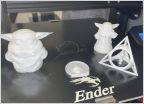 First 3D printer?
 Wireless USB
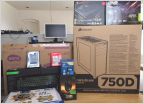 Any PC Builders Out There?
Excel Help!
Discussion in 'Technology' started by bulhas, Jun 7, 2012.


