-
Welcome to Tacoma World!
You are currently viewing as a guest! To get full-access, you need to register for a FREE account.
As a registered member, you’ll be able to:- Participate in all Tacoma discussion topics
- Communicate privately with other Tacoma owners from around the world
- Post your own photos in our Members Gallery
- Access all special features of the site
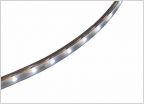 Flexible LED Strips
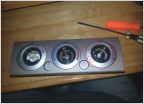 AC Control lighting question
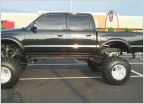 How'd you choose a lift?
 Fan only works on High AC/Heater
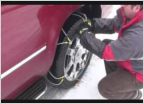 Best Snow Chains for 2014 TRD
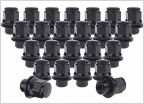 Sport wheel lug nuts
2nd Gen Regular v Mid-Grade v Premium Fuel Experiment
Discussion in '2nd Gen. Tacomas (2005-2015)' started by ziggynagy, May 19, 2015.
Page 2 of 3
Page 2 of 3